
Long-Term Care Need Data for Men and Women
When you live a long life, the risk of long-term care need grows. There is of course care you'll pay for. And lots of unpaid care provided by loved ones, family members and friends. The question many who call the Association is "How much PAID long-term care will I need?" Here is data and information to help answer that question.
Of course no one can predict your personal long-term care need. For many you'll need no long-term care (ever). Others will need paid long-term care for a year or two. And, of course, some will need paid care for a long time.
The American Association for Long-Term Care Insurance does NOT like to post averages. Because averages won't likely predict your individual need or situation. BUT because so many people ask us for this information, here goes.
The data comes from our own research and lots of review of various studies, and government reports. We hope you find it beneficial in making a decision.
If you'd like to speak to a long-term care insurance specialist who can share information and costs for LTC insurance, call the Association at 818-597-3227 (weekdays between 9am and 1pm West Coast time).
LONG-TERM CARE NEED - LATEST DATA AND STATISTICS
Long-term care is not medical care. But rather it is assistance with the basic personal tasks of everyday life. These are typically called "Activities of Daily Living" (or ADLs). They include such everyday tasks as bathing, dressing, toileting and eating.
Much long-term care is provided by spouses or partners. For free. This is called "unpaid care". But very often people will need "paid" care.
People mistakenly assume their health insurance or Medicare covers these costs. However, health insurance does not cover long-term care costs. And Medicare does not cover most LTSS expenses.
Costs will be paid for from your savings or retirement income. There's also long-term care insurance that can pay some or all of the costs. That's likely why you are reading this web page.
Your chances of needing long-term support services (LTSS) are from age 65 to death. That's what we look at here.
The typical person who is alive at age 65 (in 2024) can expect to live another 20.5 years.
Fifty-six percent (56%) can anticipate having at least some needs for LTSS; 10% are expected to have needs that last less than a year, and about 22% are expected to have needs that extend beyond five years. Again, these are generalities because various entities use a whole range of definitions for disabilities and care needs.
WOMEN HAVE MORE LONG-TERM CARE NEED THAN MEN
Long-term care is often said to be a woman's issue. That's because women are more likely to need care. And because women tend to be the (unpaid) caregivers when their husbands need care.
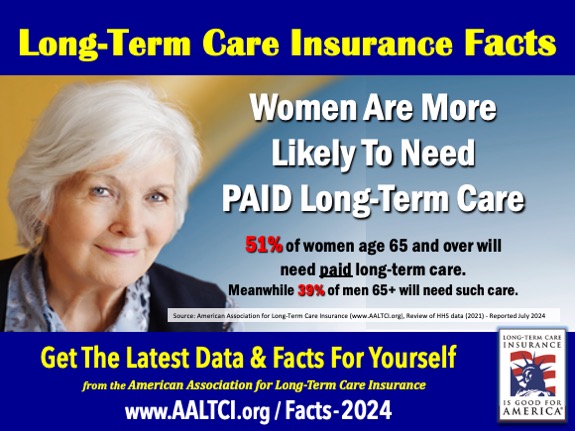
According to the American Association for Long-Term Care Insurance (July 2024) 51% of women age 65 and over will need paid long-term care. Meanwhile 39% of men 65-plus will need such care.
And that's why today a woman will pay between 30-and-40 percent more for equal amounts of long-term care insurance compared to what a man pays.
Long-term care need vary substantially. The average duration of disability is much higher for women than for men-about 3.2 years for all women as compared to 2.3 year for all men.
Among women, 61% are likely to develop a chronic disability. And the share of women needing at least five years of care is 26%.
MARRIED COUPLES HAVE LESS LONG-TERM CARE NEED THAN SINGLES
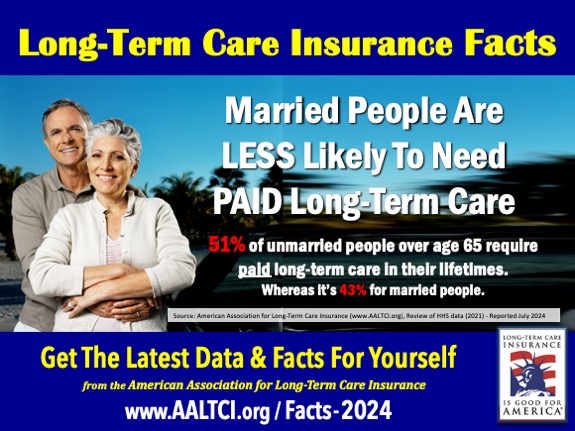
According to the American Association for Long-Term Care Insurance (July 2024) 51% of unmarried people over age 65 require paid long-term care in their lifetimes. Whereas It's 43% for married people.
Data shows that need for LTSS will vary by a range of characteristics. For example, people who are unmarried at age 65 use more paid services than those who are married at age 65.
One Long-term care need analysis by the U.S. Department of Health & Human Services (HHS) says that singles need paid care for an average of 1.3 years compared to 1.0 year for marrieds. And, those that have poorer health or lower income at age 65 use more paid services.
PROJECTED USE OF PAID LONG-TERM CARE SERVICES (Total)
Here's the question we hate being asked most. "How long will I need long-term care?" Really what people are asking is "how much insurance do I need to buy?" Because a longer long-term care insurance policy (say 5 years) costs more than a 2 or 3-year benefit policy.
So what does the averages say? Remember, averages cannot predict YOUR need. But it says that individuals will need 1.1 years of paid LTSS. Some 53% of older adults will not use paid LTSS at all. About 20% will use less than a year (measured in service days), and about 7% will use five years or more.
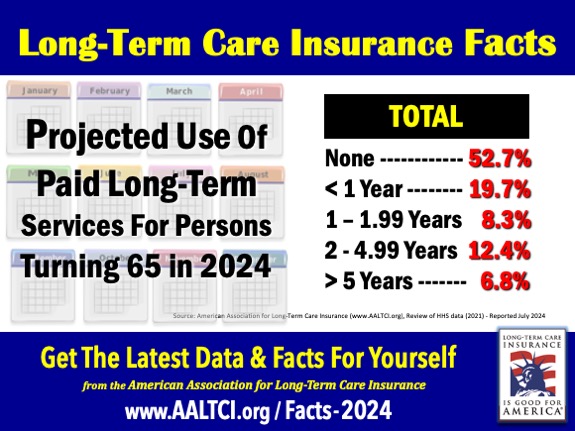
Projected Length of Use of Paid Long-Term Care Services - Total After Age 65
None - 52.7%
Less than 1 year - 19.7%
Between 1 and 1.99 Years - 8.3%
Between 2 and 4.99 Years - 12.4%
5 years or Longer - 6.8%
Source: American Association for Long-Term Care Insurance, July 2024 Report
PROJECTED USE OF PAID LONG-TERM CARE SERVICES (Women)
Women generally live longer than men, which increases their likelihood of requiring long-term care services. On average, women outlive men by about five to seven years. For instance, a woman born in 1960 has a life expectancy of approximately 73 years compared to 67 years for a man born in the same year.
As women age, they are more likely to need assistance with daily activities due to age-related health issues.
Women tend to experience higher rates of disability and chronic health problems as they age. Statistics indicate that women spend significantly more time in a disabled state at the end of their lives—approximately 2.8 years if they live past 65 and around 3.0 years if they live past 80. This increased duration of disability often necessitates paid long-term care services.
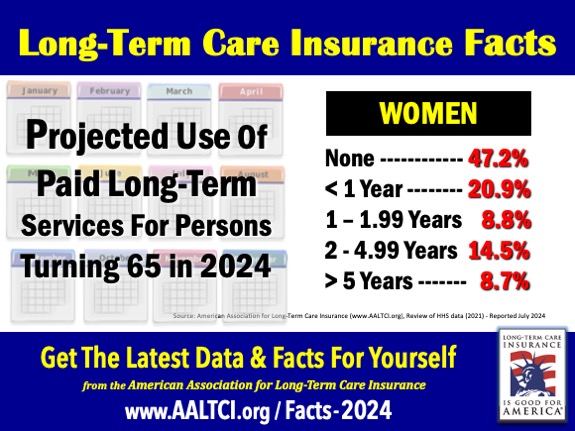
Projected Length of Use of Paid Long-Term Care Services for Women After Age 65
None - 47.2%
Less than 1 year - 20.9%
Between 1 and 1.99 Years - 8.8%
Between 2 and 4.99 Years - 14.5%
5 years or Longer - 8.7%
Source: American Association for Long-Term Care Insurance, July 2024 Report
Over 70% of nursing home residents are women, with an average admission age around 80 years old. The majority of those requiring assisted living services are also women (75.7%).
Among individuals aged 75 or older, women are significantly more likely than men to require help with activities of daily living (ADLs) such as bathing, dressing, eating, and mobility within their homes. Specifically, women are about 60% more likely than men in this age group to need assistance.
Finally, elderly women face financial challenges that can limit their ability to afford necessary long-term care services independently. Many elderly women have lower lifetime earnings, leading to fewer resources available for future healthcare needs.
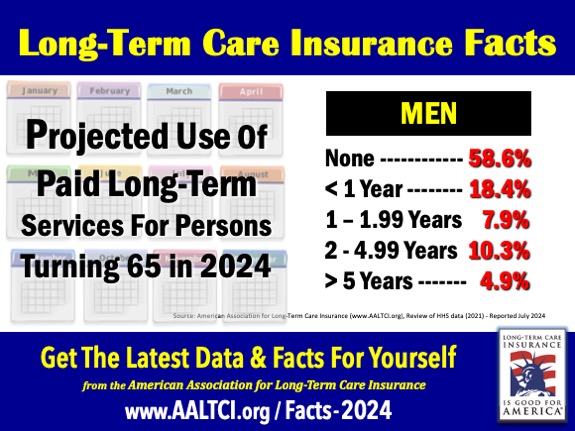
PROJECTED USE OF PAID LONG-TERM CARE SERVICES (Men)
Men often face specific health challenges as they age, including higher rates of certain chronic conditions such as heart disease, diabetes, and stroke.
These conditions can lead to functional impairments that require long-term care support services. For example, many older men suffer from multiple chronic conditions that can limit their ability to perform daily tasks independently.
For men, age-related disabilities can arise from accidents or degenerative diseases like Parkinson’s or Alzheimer’s. These necessitate the need for paid professional care.
Projected Length of Use of Paid Long-Term Care Services for Men After Age 65
None - 58.6%
Less than 1 year - 18.4%
Between 1 and 1.99 Years - 7.9%
Between 2 and 4.99 Years - 10.3%
5 years or Longer - 4.9%
Source: American Association for Long-Term Care Insurance, July 2024 Report
Speak Directly To A Long-Term Care Insurance Specialist
Call the Association offices (weekdays between 9AM and 1PM, Pacific Time) at 818-597-3227. We can answer general questions. And, IF YOU LIKE have 1 LTC specialist connect with you.
Other Valuable Resources for Consumers
2024 Long-Term Care Insurance Statistics
Long-Term Care Insurance Prices at Ages 55, 60 and 65
Best Medicare Insurance Statistics
Find A Find A Medicare Insurance Agent Near Me - Free Online Directory
Best Medigap Plan G Costs 2024 Data for Top-10 U.S. Metros
LEARN MORE
Request No-Obligation
Information & Costs
Call: 818-597-3227
- Or -