Long-Term Care Insurance Facts - Data - Statistics - 2022 Reports
The information and data provided below from the American Association for Long-Term Care Insurance is based on data researched or gathered by the organization. Information may be used with proper citation (Data from the American Association for Long-Term Care Insurance, www.aaltci.org) unless as indicated otherwise. THANK YOU..

2022 Long-Term Care Insurance Information - Click on the links to 'jump'
- BUYER INFO - AGE OF NEW POLICY ISSUE AGE - 2021/2020
- BUYER INFO - PERCENTAGE OF LTC APPLICANTS DECLINED IN 2021 By Insurers
- WHICH INSURERS STILL SELL TRADITIONAL LTC INSURANCE?
- NEW POLICY COST - 2022 Long-Term Care Insurance (AGE 55, Male - Female - Couples)
- NEW POLICY COST - 2022 Long-Term Care Insurance (AGE 60, Male - Female - Couples)
- NEW POLICY COST - 2022 Long-Term Care Insurance (AGE 65, Male - Female - Couples)
- NEW POLICY COST - Comparing Traditional LTC Insurance vs. Linked Benefit (No growth)
- NEW POLICY COST - Comparing Traditional LTC Insurance vs. Linked Benefit (3% growth)
- CLAIMS DATA - Amount Of Long-Term Care Insurance CLAIMS PAID (2018 - 2021)
- CLAIMS DATA - Ages When Long-Term Care Insurance CLAIMS BEGIN
- CLAIMS DATA - Where Do (Traditional) Long-Term Care Insurance CLAIMS BEGIN
- CLAIMS DATA - Reasons For Long-Term Care Insurance Claims (final diagnosis)
- CLAIMS DATA - Why Do (Traditional) Long-Term Care Insurance CLAIMS END
- CLAIMS DATA - Amounts Paid for LTCi Claims LOW AND HIGH + Mean Amount
- CLAIMS DATA - Number of Months - Years FROM PURCHASE TO CLAIM ELIGIBILITY
- CLAIMS DATA - Why Do LTCi Home Care CLAIMS END
- CLAIMS DATA - Why Do LTCi Nursing Home Care CLAIMS END
- CLAIMS DATA - Why Do LTCi Assisted Living Care CLAIMS END
- LTC NEED - Probability of Needing Long-Term Care Female - Currently Age 65
- LTC NEED - Probability of Needing Long-Term Care Male - Currently Age 65
- LTC NEED - Why You Want NURSING HOME AVOIDANCE insurance (Hint...Covid-19)
- LTC NEED - Nursing Home Expenditures - Out-of-Pocket Costs Grow 32.5%
- MARKET DATA - Top 10 LTC Insurance Companies by COVERED LIVES / Market Share
- MARKET DATA - Top 10 STATES for Long-Term care Insurance Policies
- RATE INCREASES - What Consumers Do When Facing LTC Premium Increase
Which Insurers Sell Traditional Long-Term Care Insurance (New coverage, 2022)
Mutual of Omaha
Trivent Luteran
National Guardian Life
New York Life
Northwestern Mutual Life
Bankers Life
Policy costs can vary significantly as can benefit plan options between these carriers. It is vital (in the opinion of the Association) to connect with a specialist able to educate and compare.
List does NOT include companies offering linked-benefit LTC options.
Long-Term Care Insurance Policy Costs - 2022 - PURCHASE AGE 55
| Annual Premium - Purchase Age 55 | ||
|---|---|---|
| Single Male, Age 55 (Select Health) $165,000 level benefits | $ 950 | |
| Single Male, Age 55 (Select Health) benefits grow at 1% yearly | $ 1,375 | |
| Single Male, Age 55 (Select Health) benefits grow at 2% yearly | $ 1,750 | |
| Single Male, Age 55 (Select Health) benefits grow at 3% yearly | $ 2,220 | |
| Single Male, Age 55 (Select Health) benefits grow at 5% yearly | $ 3,685 | |
| Single Female, Age 55 (Select Health) $165,000 level benefits | $ 1,500 | |
| Single Female, Age 55 (Select Health) benefits grow at 1% yearly | $ 2,150 | |
| Single Female, Age 55 (Select Health) benefits grow at 2% yearly | $ 2,815 | |
| Single Female, Age 55 (Select Health) benefits grow at 3% yearly | $ 3,700 | |
| Single Female, Age 55 (Select Health) benefits grow at 5% yearly | $ 6,400 | |
| Couple Both Age 55 (Select Health) $165,000 level benefits | $ 2,080 combined | |
| Couple Both Age 55 (Select Health) benefits grow at 1% yearly | $ 3,000 combined | |
| Couple Both Age 55 (Select Health) benefits grow at 2% yearly | $ 3,870 combined | |
| Couple Both Age 55 (Select Health) benefits grow at 3% yearly | $ 5,025 combined | |
| Couple Both Age 55 (Select Health) benefits grow at 5% yearly | $ 8,575 combined | |
PERCENTAGE DIFFERENCE BETWEEN LOWEST & HIGHEST PRICES - with the 3% Option
Couple (57%)
Rates above are for an initial pool of benefits equal to $165,000 (each at age 55). Value of benefits when policyholder reaches age 85 equals $222,400 each (@1%), $298,900 (@2%) or $400,500 each (@ 3%). Prices for State of IL. Prices can vary by State. Calculated: January 2022 and subject to change by the various insurers.
Back to Top
Long-Term Care Insurance Policy Costs - 2022 - PURCHASE AGE 60
| Annual Premium - Purchase Age 60 | ||
|---|---|---|
| Single Male, Age 60 (Select Health) $165,000 level benefits | $ 1,175 | |
| Single Male, Age 60 (Select Health) benefits grow at 1% yearly | $ 1,600 | |
| Single Male, Age 60 (Select Health) benefits grow at 2% yearly | $ 2,000 | |
| Single Male, Age 60 (Select Health) benefits grow at 3% yearly | $ 2,525 | |
| Single Male, Age 60 (Select Health) benefits grow at 5% yearly | $ 3,800 | |
| Single Female, Age 60 (Select Health) $165,000 level benefits | $ 1,900 | |
| Single Female, Age 60 (Select Health) benefits grow at 1% yearly | $ 2,550 | |
| Single Female, Age 60 (Select Health) benefits grow at 2% yearly | $ 3,300 | |
| Single Female, Age 60 (Select Health) benefits grow at 3% yearly | $ 4,300 | |
| Single Female, Age 60 (Select Health) benefits grow at 5% yearly | $ 6,600 | |
| Couple Both Age 60 (Select Health) $165,000 level benefits | $ 2,600 combined | |
| Couple Both Age 60 (Select Health) benefits grow at 1% yearly | $ 3,525 combined | |
| Couple Both Age 60 (Select Health) benefits grow at 2% yearly | $ 4,525 combined | |
| Couple Both Age 60 (Select Health) benefits grow at 3% yearly | $ 5,800 combined | |
| Couple Both Age 60 (Select Health) benefits grow at 5% yearly | $ 8,750 combined | |
Long-Term Care Insurance Policy Costs - 2022 - PURCHASE AGE 65
| Annual Premium - Purchase Age 65 | ||
|---|---|---|
| Single Male, Age 65 (Select Health) $165,000 level benefits | $ 1,700 | |
| Single Male, Age 65 (Select Health) benefits grow at 1% yearly | $ 2,165 | |
| Single Male, Age 65 (Select Health) benefits grow at 2% yearly | $ 2,600 | |
| Single Male, Age 65 (Select Health) benefits grow at 3% yearly | $ 3,135 | |
| Single Male, Age 65 (Select Health) benefits grow at 5% yearly | $ 4,200 | |
| Single Female, Age 65 (Select Health) $165,000 level benefits | $ 2,700 | |
| Single Female, Age 65 (Select Health) benefits grow at 1% yearly | $ 3,400 | |
| Single Female, Age 65 (Select Health) benefits grow at 2% yearly | $ 4,230 | |
| Single Female, Age 65 (Select Health) benefits grow at 3% yearly | $ 5,265 | |
| Single Female, Age 65 (Select Health) benefits grow at 5% yearly | $ 7,225 | |
| Couple Both Age 65 (Select Health) $165,000 level benefits | $ 3,750 combined | |
| Couple Both Age 65 (Select Health) benefits grow at 1% yearly | $ 4,735 combined | |
| Couple Both Age 65 (Select Health) benefits grow at 2% yearly | $ 5,815 combined | |
| Couple Both Age 65 (Select Health) benefits grow at 3% yearly | $ 7,150 combined | |
| Couple Both Age 65 (Select Health) benefits grow at 5% yearly | $ 9,675 combined | |
PERCENTAGE DIFFERENCE BETWEEN LOWEST & HIGHEST PRICES - with the 3% Option
Couple (17%)
Rates above are for an initial pool of benefits equal to $165,000 (for EACH)(each at age 65). Value of benefits when EACH policyholder reaches age 85 equals $201,300 each (@1%), $245,200 (@2%) or $296,000 each (@ 3%). Prices for State of IL. Prices can vary by State. Calculated: January 2021 (Age 60 added July 2021)
Back to Top
Compare Traditional Long-Term Care Insurance to Linked Benefit
- NO Inflation Growth -
| Traditional Long-Term Care Insurance Policy - NO INFLATION GROWTH - YEARLY PREMIUMS | ||
|---|---|---|
| Single Male, Age 55 - Pool of LTC Benefits = $165,000 | $ 950 | |
| Single Female, Age 55 - Pool of LTC Benefits = $165,000 | $ 1,500 | |
| Linked-Benefit (Life Insurance + LTC) Policy - Company A - YEARLY PREMIUM PAYMENTS | ||
|---|---|---|
| Single Male, Age 55 - Pool of LTC Benefits = $180,000 / Min. death benefit = $120,000 | $ 4,625 | |
| Single Female, Age 55 - Pool of LTC Benefits = $180,000 / Min. death benefit = $120,000 | $ 4,600 | |
| Linked-Benefit (Life Insurance + LTC) Policy - Company B - ONE SINGLE PREMIUM PAYMENTS | ||
|---|---|---|
| Single Male, Age 55 - Pool of LTC Benefits = $180,000 / Min. death benefit = $130,000 | $ 75,900 | |
| Single Female, Age 55 - Pool of LTC Benefits = $180,000 / Min. death benefit = $130,000 | $ 77,000 | |
| Linked-Benefit (Life Insurance + LTC) Policy - Company C - YEARLY PREMIUM PAYMENTS | ||
|---|---|---|
| Single Male, Age 55 - Pool of LTC Benefits = $167,000 / Min. death benefit = $167,000 | $ 5,010 | |
| Single Female, Age 55 - Pool of LTC Benefits = $167,000 / Min. death benefit = $167,000 | $ 4,550 | |
Rates above include NO INFLATION GROWTH OPTION so benefit pool WILL NOT INCREASE. Prices can vary by State and subject to change by the various insurers. Calculated: January 2022
Compare Traditional Long-Term Care Insurance to Linked Benefit
- WITH 3% Annual Inflation Growth -
| Traditional Long-Term Care Insurance Policy - With 3% Annual Growth - YEARLY PREMIUMS | ||
|---|---|---|
| Single Male, 55 - LTC Benefits @ Age 90 = $464,300 / no death benefit | $ 2,220 | |
| Single Female, 55 - LTC Benefits @ Age 90 = $464,300 / no death benefit | $ 3,700 | |
| Linked-Benefit (Life Insurance + LTC) Policy - Company A - YEARLY PREMIUM PAYMENTS | ||
|---|---|---|
| Single Male, 55 - LTC Benefits @ Age 90 = $521,850 / $226,000 growing death benefit | $ 6,300 | |
| Single Female, 55 - LTC Benefits @ Age 90 = $521,850 / $242,500 growing death benefit | $ 6,750 | |
| Linked-Benefit (Life Insurance + LTC) Policy - Company C - YEARLY PREMIUM PAYMENTS | ||
|---|---|---|
| Single Male, 55 - LTC Benefits @ Age 90 = $455,300 / Min. death benefit = $167,0000 | $ 6,710 | |
| Single Female, 55 - LTC Benefits @ Age 90 = $455,300 / Min. death benefit = $167,000 | $ 7,210 | |
Back to Top
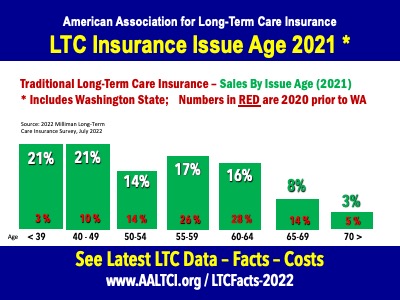
Issue Age for New (Traditional) LTC Insurance Policies (2021)
"The sweet spot for applying for long-term care insurance is between ages 55 and 65. After age 70, it becomes difficult to find and be accepted for traditional LTC insurance coverage. Numbers in 2021 skewed younger BECAUSE of the State of Washington program where many younger people applied for LTC insurance in order to avoid a tax imposed by the State of Washington," explains Jesse Slome, director of the American Association for
Long-Term Care Insurance.
Note: the numbers in RED represent the 2020 issue ages. In 2020, 54% of applicants were between ages 55 and 64.
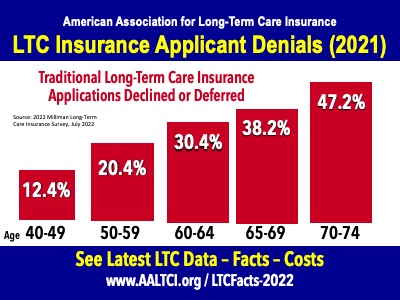
Percentage of LTC Insurance Applicants Declined (2021)
"Your money pays for long-term care insurance, but it's your health that really buys it. Insurers decline nearly half of those who apply after age 70," explains Jesse Slome, director of the American Association for Long-Term Care Insurance.
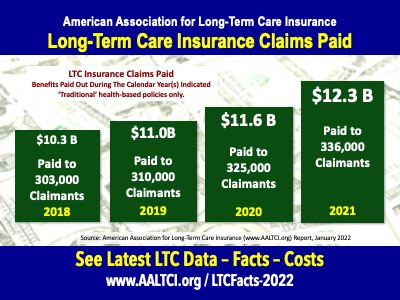
Total Amount Of Claims Paid (2018 - 2021)
Amount of long-term care insurance claims paid for traditional LTCi policies. No figure available for hybrid or other policies.
When citing data, please credit: "American Association for Long-Term Care Insurance, 2022, www.aaltci.org"
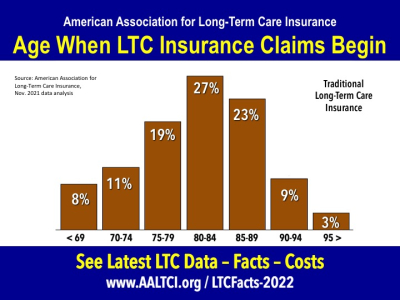
Back to TopWhat Ages Do (Traditional) Long-Term Care Insurance Claims Begin
Most long-term care insurance claims begin when the policyholder is in their 80s or older. Half begin between ages 80 and 89.
When citing data, please credit: "American Association for Long-Term Care Insurance, 2022, www.aaltci.org"
Back to TopWhere Do (Traditional) Long-Term Care Insurance Claims Begin
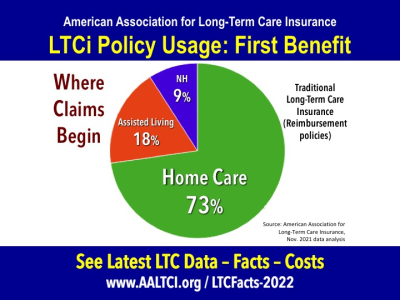
The vast majority (73%) of new long-term care insurance claims begin with care received at home. Followed by in an Assisted Living setting (18%) and finally in a skilled nursing home (9%). This data based on traditional LTCi, reimbursement models.
When citing data, please credit: "American Association for Long-Term Care Insurance, 2022, www.aaltci.org"
Back to TopWhy Do (Traditional) Long-Term Care Insurance Claims End
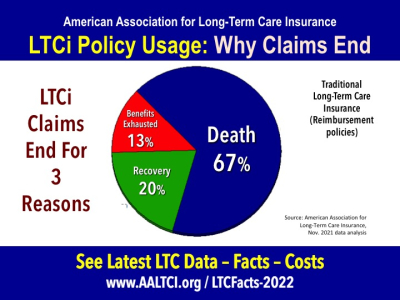
The vast majority (67%) of long-term care insurance claims end due to death of the policyholder. Note that 20% of claims end because the individual 'recovers'. They may go on claim again at some time in the future. Only 13% of the claims end because the policy benefits were exhausted (meaning they used all the available benefits). This data based on traditional LTCi, reimbursement models.
When citing data, please credit: "American Association for Long-Term Care Insurance, 2022, www.aaltci.org"
Back to TopReasons For Long-Term Care Insurance Claims (Final diagnosis of claimants)
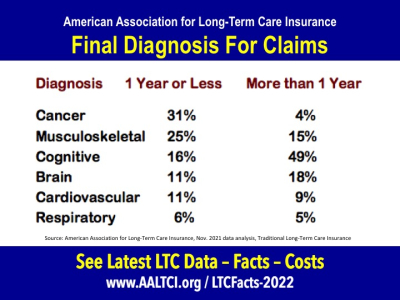
This chart looks at the final diagnosis logged for long-term care insurance claims. For claims that last 1 year or less, conditions like cancer and musculoskeletal (Common musculoskeletal disorders include: Carpal Tunnel Syndrome. Tendonitis. Muscle / Tendon strain). For claims that last longer, cognitive issues are undertandably more commong.
When citing data, please credit: "American Association for Long-Term Care Insurance, 2022, www.aaltci.org"
Back to TopWhy Do Home Care Claims End
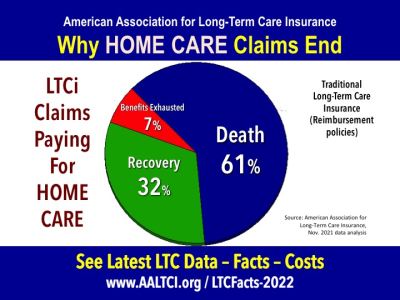
The vast majority (61%) of long-term care insurance claims that pay for care at home end because the policyholder has died. Nearly a third (32%) recover. Again, note that does mean, they might again qualify for benefits due to another future need. Some 7% of policy claims end because the policy benefits have been used up (exhausted).
When citing data, please credit: "American Association for Long-Term Care Insurance, 2022, www.aaltci.org"
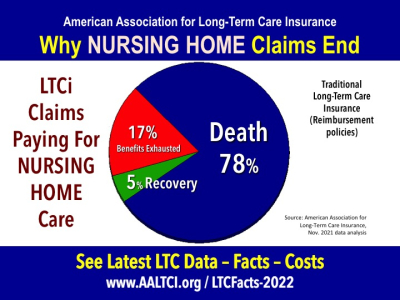
Back to TopWhy Do Nursing Home Claims End
The vast majority (73%) of new long-term care insurance claims begin with care received at home. Followed by in an Assisted Living setting (18%) and finally in a skilled nursing home (9%). This data based on traditional LTCi, reimbursement models.
When citing data, please credit: "American Association for Long-Term Care Insurance, 2022, www.aaltci.org"
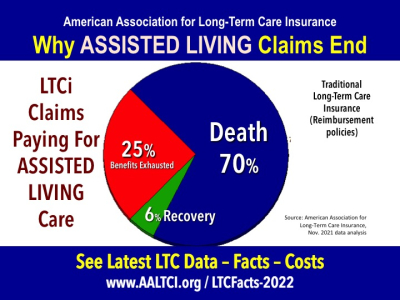
Back to TopWhy Do Assisted Living Claims End
The vast majority (73%) of new long-term care insurance claims begin with care received at home. Followed by in an Assisted Living setting (18%) and finally in a skilled nursing home (9%). This data based on traditional LTCi, reimbursement models.
When citing data, please credit: "American Association for Long-Term Care Insurance, 2022, www.aaltci.org"
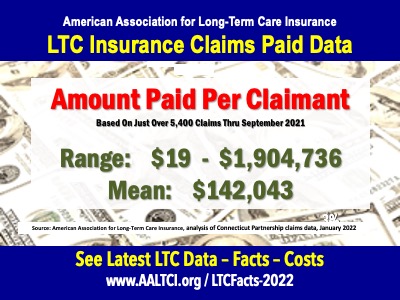
Back to TopAmounts Paid To Claimants, Low - High and Mean
The 'mean' amount of claims paid reported thru 2021 (analysis of 5,439 claims by Connecticut Partnership for Long-Term Care) was $142,043. Some claims are small. Some are very large.
When citing data, please credit: "American Association for Long-Term Care Insurance, 2022, www.aaltci.org"
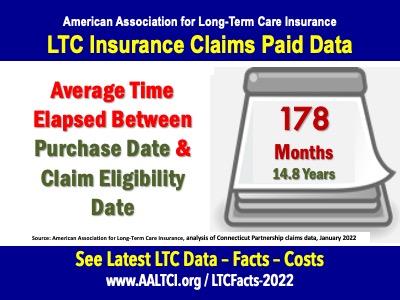
Back to TopAverage Time Elapsed Between Policy Purchase Date and Eligibility Date
The average is 14.8 years. The report by the Connecticut Partnership for Long-Term Care found that the age range at time of claim ran from 31-years to 101-years old. The mean was 80 years of age.
When citing data, please credit: "American Association for Long-Term Care Insurance, 2022, www.aaltci.org"
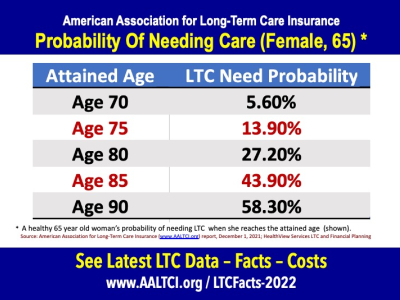
Back to TopProbability of Needing Care: A Female Who Is Currently Age 65
For a woman who is currently age 65, this table shows her probability of needing long-term care at different ages. It assumes she is living to the respective ages shown. Care need is defined as being unable to perform two or more of the six ADLs (bathing, continence, dressing, eating, toileting, and transferring), or, being “severely cognitively impaired”.
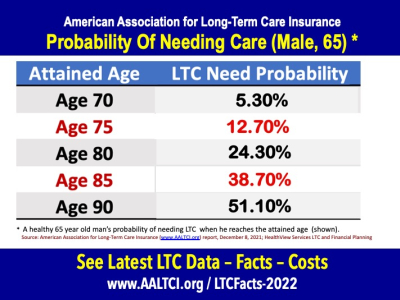
Probability of Needing Care: A Male Who Is Currently Age 65
For a man who is currently age 65, this table shows her probability of needing long-term care at different ages. It assumes he is living to the respective ages shown. Care need is defined as being unable to perform two or more of the six ADLs (bathing, continence, dressing, eating, toileting, and transferring), or, being “severely cognitively impaired”.
Why You Need (& Want) Nursing Home Avoidance Insurance
Long-term care insurance provides benefits when you need (qualifying) care IN YOUR OWN HOME. That's what people want. And, the majority of LTC insurance claims pay for care at home. Initially half of all Covid-19 deaths were in long-term care facilities. By the end of January 2022, it was still 23%.

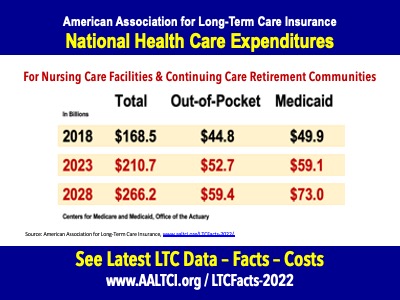
Out-Of-Pocket Costs For Nursing Home Care To Grow 32.5%
Total national expenditires for nursing care facilities and Continuing Care Retirement
Communities will grow 58.4% (2018 - 2028). Projected Out-Of-Pocket expenditures will grow by 32.5% (2018 - 2028).
Analysis of data from the Medicare Office of the Actuary.
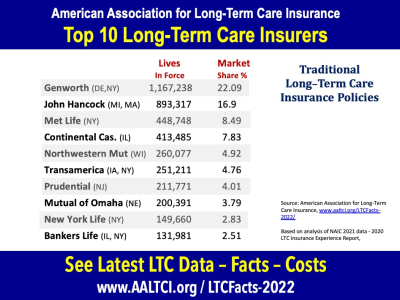
Top 10 Long-Term Care Insurance Companies - By Covered Lives
Covered lives for the top-10 insurers based on latest data for traditional (health-based) long-term care insurance policies.
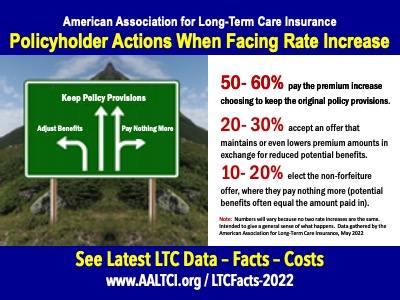
What Consumers Do When Facing A Long-Term Care Insurance Policy Rate Increase
The majority keep their coverage levels (paying the increase) because they understand the value of what they purchased and are closer to needing benefits. Others adjust their policy provisions - typically reducing the inflation growth option (say from 5% to 3%, etc.).
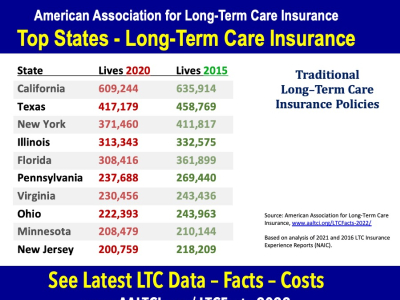
Top 10 STATES for Long-Term Care Insurance - By Covered Lives
Covered lives for the top-10 insurers based on latest data for traditional (health-based) long-term care insurance policies.
Back to Top

REPORTERS - EDITORS & BLOGGERS

If you would like additional information please call or email Jesse Slome, Executive Director of the American Association for Long-Term Care Insurance.
Phone: 818-597-3227
Click Here To Email Jesse Slome